Alzheimer’s Disease Blood Analysis
Abstract
Alzheimer’s Disease (AD) is an irreversible, progressive neurodegenerative disorder that slowly destroys a person’s cognitive and physical abilities. The cause of AD is unclear, but is believed to be a combination of genetic, environmental and lifestyle factors. Because the only way to definitely diagnose AD is post mortem, the search for earlier definitive detection is crucial. One way of doing this is by analyzing blood samples to detect biomarkers and microRNAs. A biomarker is defined as a characteristic that is objectively measured as an indicator of normal biological processes, while microRNAs (miRNAs) are non-coding RNA molecules that are involved in the regulation of gene expression. Recent studies show miRNAs and biomarkers as possible tools for AD diagnosis, thus, leading us to analyze blood miRNA data for our study. Utilizing influences from various other studies, we examined 67 blood samples of AD and control patients through our custom genetics pipeline in hopes of a breakthrough in understanding the pathology of the disease. We then implemented two different statistical tests, a non-parametric hypothesis test (Wilcoxon-Mann-Whitney Test) and a parametric hypothesis t-test (DESeq2). From these tests we were able to isolate nine significant miRNAs to perform further analysis on its relationship and effect to AD.
Introduction
Background
AD is an age-related neurodegenerative disease that currently affects more than 5.5 million Americans and is considered the 6th leading cause of death in the United States[1]. It is an irreversible disease that causes declines in both mental and physical abilities as a result of rapidly declining brain function. The pathological features of AD include amyloid plaques, neurofibrillary tangles, chronic inflammation, vascular contributions and the loss of neural connections and cell death[1]. These features contribute to symptoms like confusion, difficulty speaking and severe memory loss. The disease itself can be diagnosed at all age levels; however, it is generally more common with individuals 65 years of age or older. Current treatments can help manage the symptoms, but neither a cure nor a cause for the disease has yet to be identified.
Biomarkers
A biomarker is defined as a characteristic that is objectively measured and evaluated as an indicator of normal biological processes, pathogenic processes, or pharmacologic responses to a therapeautic intervention[2]. They assist in understanding what happens inside a living body and assist doctors and researchers in diagnosing and monitoring diseases. For Alzheimer’s Disease, measurements of the brain image scans, cerebrospinal fluid and blood are common biomarkers associated with the disease as well as other neurological diseases. Both the cerebrospinal fluid and blood biomarkers are involved with identifying the proteins, beta-amyloid 42 and tau, which revolve around the brain and its functions[3].
miRNA in Relation to Alzheimer’s Disease
MicroRNAs (miRNAs) are non-coding RNA molecules that are involved in the regulation of gene expression[4]. How miRNA regulates gene expression is by binding to Messenger RNA (mRNA) and preventing mRNA from producing protiens. Although the complete understanding of miRNA is still to be discovered, it is believed they play a crucial role in being able to control metablloic and cellular pathways[4]. The role of miRNA is important in the project, not only because our data is comprised of blood samples that contain miRNA information, but the ability of miRNA to be considered its own biomarker as well. Specifically, circulating miRNAs are believed to be an additional measurement aside from protein levels, that could lead to increased effectiveness in diagnosing AD in patients[5].
Methods
The data utilized for this project is from SRA study SRP022043[6]. This dataset includes 45 blood samples from Alzheimer’s Disease patients and 22 blood samples from control patients. We utilized the wget function to obtain the data and store it in our database. Wget is a computer program that retrieves content from web servers[7]. Afterwards, we ran FastQC to all of the files to ensure the quality of each file[8]. We then ran cutadapt to remove the adapter sequences for the files, and then ran fastqc again to check the quality of each read sequence again[9]. If the reads did not pass, we decided to remove them before running kallisto. Kallisto allowed us to generate the quantification of non-coding RNA of each sample[10]. We then ran a pandas script to combine all of the individual tsv’s into a counts matrix that will be used for DESeq2, and a Wilcoxon Test[11,12]. After getting the significant values from DESeq2, we then generated graphs and figures while also trying to identify various biomarkers that may be significant between Alzheimer’s patients and control patients (markers that have a difference in quantification between the two groups). We then researched more regarding the functions of those biomarkers and how it relates to Alzheimer’s.
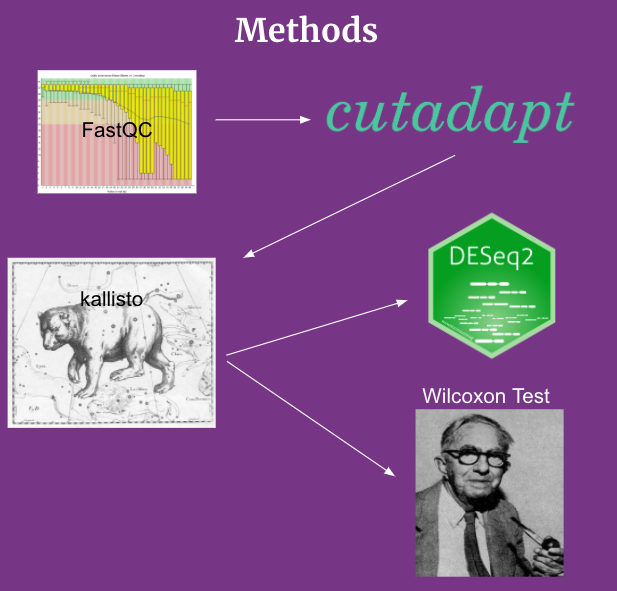
Figure 1. Flowchart of our Methods Pipeline.
Results
Our DESeq2 Results showed that for all of our samples we had no significant miRNA’s, all had p_values > 0.05 [Figure 2]. However, we noticed that around 1870 of the miRNA had a p_value of exactly 1.0 so, we filtered for p_values that were less than 1 and found 56 miRNA’s. In the original study, they noted that there were 56 different miRNA that they got as significant; the exact same number as our DESeq2 p_values that did not equal exactly 1. Still, we considered our DESeq2 results as inconclusive. Continuing along our pipeline, we performed a Wilcoxon Test. Our Wilcoxon Test results showed that there were actually 63 significant values with a p_value < 0.05 [Figure 3]. Looking at significant values from Wilcoxon Test and the insignificant values from DESeq2, we noticed that there was an overlap between the two, meaning that our results from DESeq2 were “correct” just not fully the same as the original research paper. From our results, we narrowed it down to the 11 most significant values that were seen in our DESeq2 output, our Wilcoxon output, and the original study.
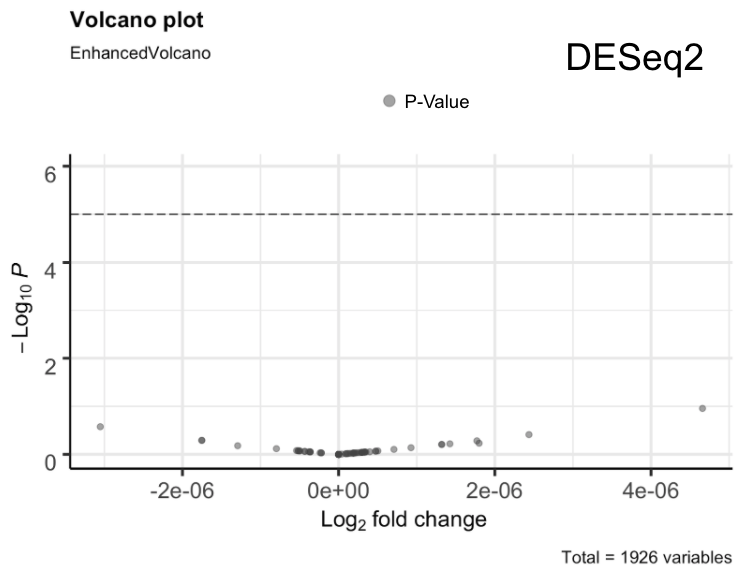
Figure 2. DESeq2 Volcano plot of p_values
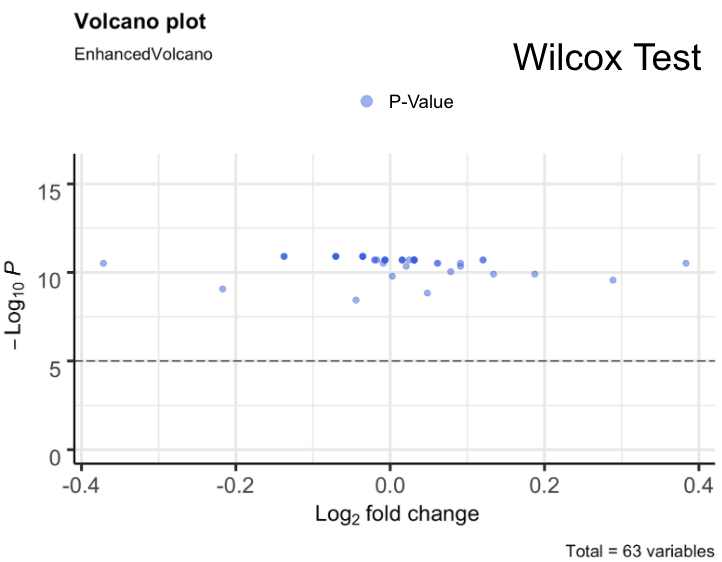
Figure 3. Wilcox Volcano Plot of p_values
We took our most upregulated and downregulated miRNA results from DESeq2 which were: hsa-miR-766 (ENST00000390223.3), and hsa-miR-1248 (ENST00000629190.1) respectively [Figure 4]. We took our most upregulated and downregulated miRNA values from the Wilcoxon Test which were: hsa-miR-6882 (ENST00000619233.1) and hsa-miR-26b (ENST00000362251.4), respectively [Figure 5].
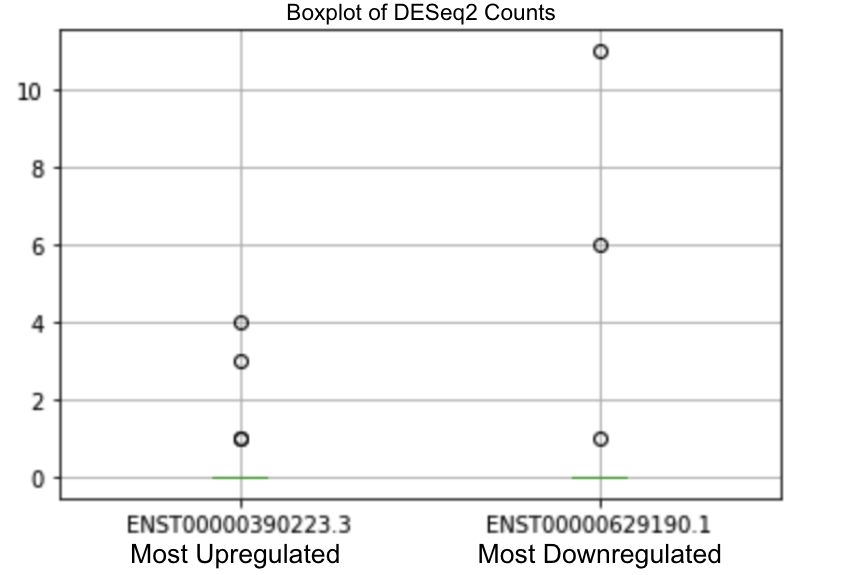
Figure 4. DESeq Boxplot of most upregulated and downregulated miRNA
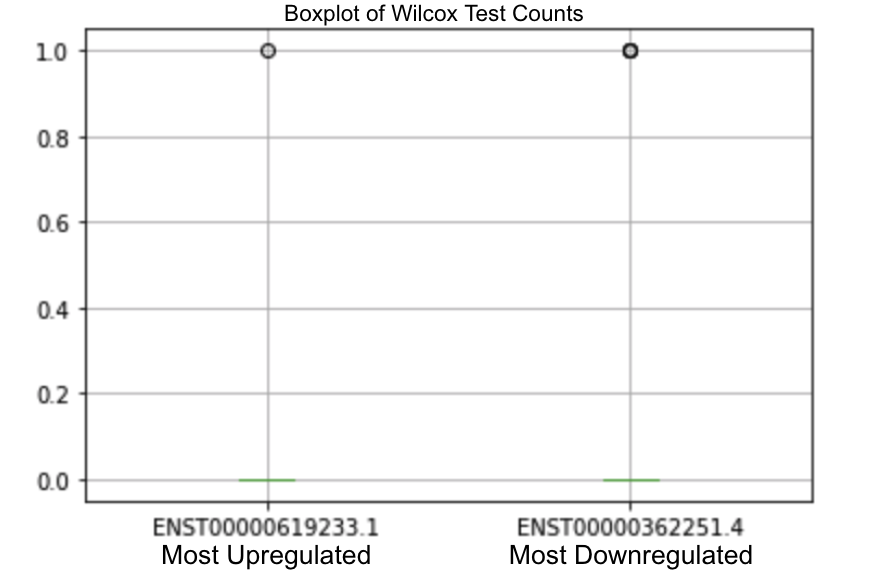
Figure 5. Wilcox Test Boxplot of most upregulated and downregulated miRNA
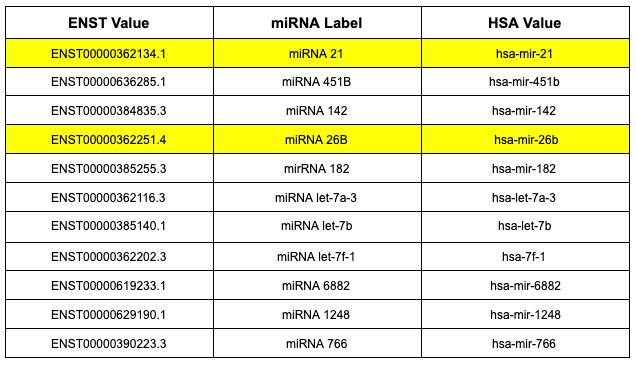
Figure 6. The eleven miRNA values that overlapped between our DESeq2 output, our Wilcoxon output, and the original study. ENST, miRNA label and HSA value for each miRNA is present.
Discussion
Within our analysis, we were able to find 11 miRNA values that overlapped between the two tests we performed on our data. We went ahead and researched each miRNA value to obtain additional information about them and whether they had any direct association to AD. Some common processes seen through each miRNA value include gene silencing and regulation processes that involved apoptosis. miRNA 6882 was the only miRNA value that was not able to find sufficient information to draw any conclusions relating to the miRNA or to the other 11 values.
What was common among the miRNA values we obtained were associations to various forms of cancer, such as carcinoma. miRNA 21 in particular, is responsible for numerous biological processes and diseases from cancer to cardiovascular diseases[13]. Additional insight into the expression of miRNA 21 found it to be upregulated in almost all types of cancer some of which include breast cancer, colon cancer, and lung cancer. miRNA 182 and miRNA 766 are some of the other miRNA values that have some connection to cancer development that are included in the 11 miRNA values we isolated in our results.
Using the National Center for Biotechnology Information (NCBI) website, we were able to focus on our second miRNA value of interest, miRNA 26B. According to the report on miRNA 26B on the NCBI website, processes associated with this particular miRNA include negative regulation, or a blocked expression, of a defense response to a virus as well as the positive regulation, or gene undergoing transcription, of apoptotic signaling pathways[14]. Apoptotic signaling is a process that is programmed for cell death[15]. miRNA 26B is interesting in particular for our project because it is also associated with the positive regulation of tau-protein kinase activity. Tau is a common protein associated with AD through neurofibrillary tangles, which are collections of the tau protein[14]. These collections, commonly found in the neurons, block the transport system of a neuron which damages neuron communication. Neurofibrillary tangles, through tau proteins, and the buildup of amyloid plaques, which consists of the toxic protein beta-amyloid 42, are just some of the main characteristics of AD[16].
Overall, we realize how complex AD is and the need for more research to be done in order to find a cure or definitive detection of this disease. miRNAs and other biomarkers can be a place to start, but there are also so many other factors that can contribute to and need to be examined more. However, we hope that the research and findings that we have done could be a starting point for future research, especially if it involves utilizing blood based samples similar to our study. Considering the promising outlook for using blood based data in the fight against AD, we hope that there could be more studies done on miRNAs and its functions, leading to more possible relationships/correlations between that and AD. If we were to do further investigation, we would like to have more information on the cognitive tests previously mentioned and how they could supplement the data further. Obtaining a much larger data sample size would also be something we would want to do. But, we hope that our current findings could help contribute to existing research on AD pathways or may lead to the beginning of novel research on this disease.
Reference
[1] NIH Alzheimer’s Facts URL: https://www.nia.nih.gov/health/alzheimers-disease-fact-sheet
[2] NCBI Biomarkers Definition URL: https://www.ncbi.nlm.nih.gov/pmc/articles/PMC3078627/
[3] Biomarker Types URL: https://www.ncbi.nlm.nih.gov/books/NBK326791/
[4] MicroRNA Definition URL: https://www.ncbi.nlm.nih.gov/pmc/articles/PMC3048316/
[5] miRNA and Alzheimer’s Disease URL: https://www.ncbi.nlm.nih.gov/pmc/articles/PMC4053843/
[6] Main Article/Project Inspiration URL: https://www.ncbi.nlm.nih.gov/pmc/articles/PMC4053778/
[7] WGET Function Description URL: https://www.gnu.org/software/wget/
[8] Andrews, S. Babraham Bioinformatics URL: https://www.bioinformatics.babraham.ac.uk/projects/fastqc/
[9] Martin, Marcel Bioinformatics in Action (2011) URL: http://journal.embnet.org/index.php/embnetjournal/article/view/200/479
[10] kallisto description URL: https://pachterlab.github.io/kallisto/about
[11] Wilcoxon Test Description URL: https://en.wikipedia.org/wiki/Wilcoxon_signed-rank_test
[12] DESeq2 Application description URL: https://bioconductor.org/packages/release/bioc/html/DESeq2.html
[13] miRNA-21 description URL: https://en.wikipedia.org/wiki/MIRN21
[14] miRNA-26B description URL: https://www.ncbi.nlm.nih.gov/gene/407017
[15] Apoptosis Definition URL: https://www.cancer.gov/publications/dictionaries/cancer-terms/def/apoptosis
[16] NIH Alzheimer Brain Impact URL: https://www.nia.nih.gov/health/what-happens-brain-alzheimers-disease